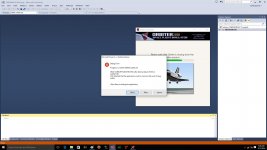
OK. so on the settings

But then I click on Endurance.dll but nothing happens
But then I click on Endurance.dll but nothing happens
ORBITER-FORUM will be temporarily closed at 2026-07-23 18:00 UTC while we complete some OF maintenance tasks. The amount of downtime is expected to take up to one hour, but probably less.
Just click on the magnifying glass in the top right corner of the image to zoom in. Things should be more readable then.Can't read anything on those images.
Just click on the magnifying glass in the top right corner of the image to zoom in. Things should be more readable then.

DLLCLBK VESSEL *ovcInit(OBJHANDLE hvessel, int flightmodel)
{
	return new TESTVC(hvessel, flightmodel);
}

DLLCLBK void ovcExit(VESSEL *vessel)
{
	if (vessel) delete (TESTVC*)vessel;//this is the issue
}
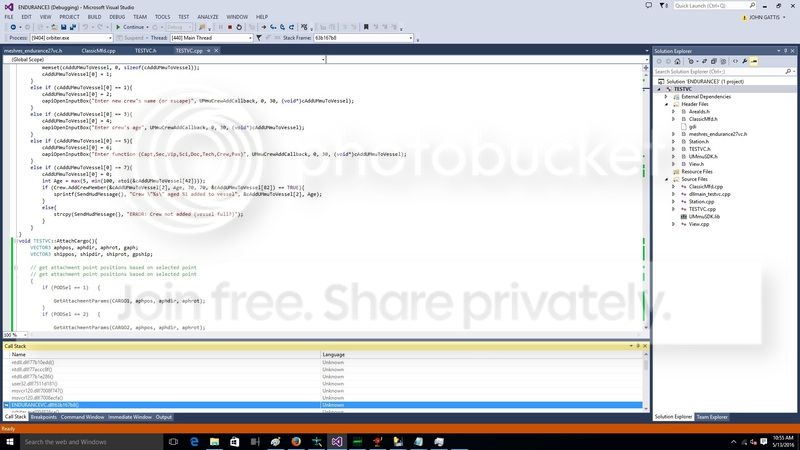
ok. I got it to display the issue. not sure how to fix though?
>	ENDURANCEVC.dll!TESTVC::`scalar deleting destructor'(unsigned int)	C++
ENDURANCEVC.dll!ovcExit(VESSEL * vessel) Line 17 C++Thanks.
So how do I fix it?
class TESTVC : public VESSEL2 {
public:
	TESTVC(OBJHANDLE hVessel, int flightmodel);
~TESTVC();// --------------------------------------------------------------
// Destructor
// --------------------------------------------------------------
TESTVC::~TESTVC() {
delete viewController;
delete mfdController;
}TESTVC::TESTVC(OBJHANDLE hObj, int fmodel)
: VESSEL2(hObj, fmodel)
{
viewController = new Station::Controller(this);
mfdController = new ClassicMfd(4,
g_Param.hFont[0], g_Param.col[0], g_Param.hBrush[0], g_Param.hBrush[1],
&MFD_BUTTONS_FN_DIM, MFD_BUTTONS_FN_RECT, &MFD_BUTTONS_SYS_DIM, MFD_BUTTONS_SYS_RECT); mfdController->HandleLoadMesh(meshi_VC, meshhg_VC);bool TESTVC::clbkLoadVC(int id) { // ID is the Preset Camera Position
SURFHANDLE const tex3 = oapiGetTextureHandle(meshhg_VC, 4);
viewController->HandleLoadVC(id);
mfdController->HandleLoadVC(id);
oapiVCRegisterArea(AID_FUELSTATUS, _R(0, 0, 486, 302), PANEL_REDRAW_ALWAYS, PANEL_MOUSE_IGNORE, PANEL_MAP_BACKGROUND, tex3);
static VCHUDSPEC hud_pilot = { 2, 38, { 0, -16.023, 7.459 }, 0.338 };
oapiVCRegisterHUD(&hud_pilot);
return HandleLoadVC(id);
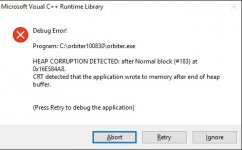
}I rebooted and ran debugger. Now I get this errors. In the call stack the Endurancevc.dll does show up. the only ones is the ntdll.dll and msvcr120.dll.
DLLCLBK void InitModule(HINSTANCE hModule)
{

#ifdef _DEBUG
	// NOTE: _CRTDBG_CHECK_ALWAYS_DF is too slow
	_CrtSetDbgFlag(_CRTDBG_ALLOC_MEM_DF |
		_CRTDBG_CHECK_CRT_DF |
		_CRTDBG_LEAK_CHECK_DF);
#endif