Updates Tiangong 1 reentry

cristiapi

New member
Joined
May 26, 2014
Messages
222
Reaction score
0
Points
0
Location
Ancona
I wrote a program to calculate the Tiangong 1 reentry date.
Starting from a TLE, my prog propagate the initial state down to an altitude of 20 km.
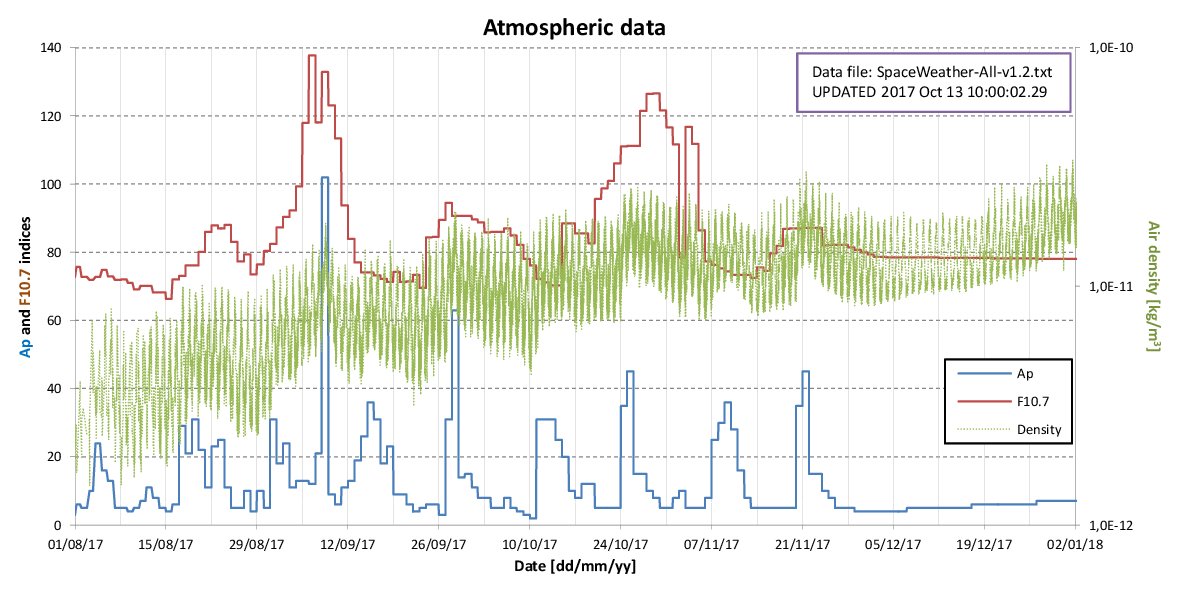
The simulation uses the NRLMSISE-00 atmospheric model considering the observed and predicted solar activity and geomagnetic levels.

As can be seen from the attached graph, while my calculations are in fairly good agreement with this site:
http://www.satflare.com/track.asp?q=37820#TOP
(“This object is expected to decay around Mon, 16/07/2018 06:20:00 +/- 84 hours UTC (these predictions are provided by Joseph Remis).”),

the reentry dates calculated by my program are well beyond the date calculated here:
http://www.aerospace.org/cords/reentry-predictions/tiangong-1-reentry/
(“Tiangong-1 is predicted to reenter in 2018 January ± 2 months.”).

I have 2 questions:
1) has anyone tried to simulate the Tiangong 1 reentry using Orbiter? (Since it’s almost impossible to predict the exact impact location, I’m only interested in the possible reentry date).
2) does anyone know another site where the reentry date is calculated?
 

Attachments

  • Tiangong_1_reentry.pdf
    455.3 KB · Views: 80

boogabooga

Bug Crusher
Joined
Apr 16, 2011
Messages
2,999
Reaction score
1
Points
0
1) has anyone tried to simulate the Tiangong 1 reentry using Orbiter? (Since it’s almost impossible to predict the exact impact location, I’m only interested in the possible reentry date).

It sounds interesting. We need to know the exact mass, area, and ballistic coefficient. (Or their product).

Also, I don't think there is any way in Orbiter to input predicted solar activity, is there? :shrug:

On your graph, what am I looking at? It looks like you are predicting mmultiple re-entry dates over a wide range of time. Is this the result of Monte Carlo simulations or something?
 

cristiapi

New member
Joined
May 26, 2014
Messages
222
Reaction score
0
Points
0
Location
Ancona
It sounds interesting. We need to know the exact mass, area, and ballistic coefficient. (Or their product).

The mass and the area (cross-section) are known with a sufficient degree of accuracy, but the ballistic coefficient is very hard to estimate (it's not constant) and small differences lead to big fluctuations on the predicted date.

Also, I don't think there is any way in Orbiter to input predicted solar activity, is there? :shrug:

I should "translate" my NRLMSISE-00 class in an atmosphere module (dll) for Orbiter...
But a simulation with the Orbiter's NRLMSISE-00 built-in module still would be interesting because I can use my atmospheric model with the default Orbiter's values (excluding the data file) and then I can estimate the differences including the data file for the predicted solar activity and geomagnetic levels.

On your graph, what am I looking at? It looks like you are predicting mmultiple re-entry dates over a wide range of time. Is this the result of Monte Carlo simulations or something?

I download updated TLE that I use to calculate the initial position and velocity of the Tiangong-1. Then I propagate the state starting from that TLE. The graph shows the predicted altitude (above the WGS 84 ellipsoid) as a function of time for each TLE I downloaded.
I generated the graph using 52 TLE, so the graph shows 52 orbit predictions.
From those TLEs, the most probable reentry date range from 2018-09-10 to 2018-10-14.

If this topic is of some interest, I can periodically upload (say once a week or twice in a month) the new version of the graph where I use different colors for the plots based on the age of the starting TLE (new TLEs are more "important").
 

cristiapi

New member
Joined
May 26, 2014
Messages
222
Reaction score
0
Points
0
Location
Ancona
Here is the updated result which comes from a vastly improved version of my simulation:

TIA1-2017-09-04.png


I read the Tiangong-1 starting position and velocity from a TLE, then I integrate those vectors down to an altitude of 80 km.
Since in that graph I used 103 TLEs, 103 trajectories are showed.
The color is for the age of the TLE: new TLEs are vivid blue.

In the simulation, the Earth is the ellipsoid WGS 84 which includes the zonal spherical harmonics up to order and degree 20. Then I add:
• perturbations from: Sun, Moon and all the planetary systems;
• relativistic acceleration;
• atmospheric acceleration based on the NRLMSISE-00 model along with a data file for the updated geomagnetic and solar activity indices.

The initial state of the celestial bodies is read from the DE431 ephemerides. At the end of the simulation, after about 200 days, the differences between the position calculated with my simulation and those calculated with the DE431 are about 1.8 km for the Moon, 600 m for the Earth and a few meters for the other bodies.

The integrator is the very good DOPRI853. The step I use is about 144 s; with that step, the simulation speed is about 6.85 days/s.

The mathematical model of the Tiangong-1 is hard to write and I don’t know its attitude. According to my simulation, it seems that it rotates about the lateral (pitch) axis of about 5 deg/day, but without a visual observation I can only guess that value.
 
Last edited:

boogabooga

Bug Crusher
Joined
Apr 16, 2011
Messages
2,999
Reaction score
1
Points
0
I think you are going about this a little wrong. You need to calibrate the ballistic coefficient of the spacecraft before you have any kind of meaningful simulation. If the trajectory from the 1st TLE is very different from the 103rd TLE, the only thing you know for sure is that you are wrong there. A "correct" model would predict the same trajectory (reentry date) regardless of what TLE you use as your starting point.

Start with the first TLE position, velocity, and time and integrate until the epoch of the 103rd TLE. How close do the positions and velocities agree at that time? If those two don't agree, your model is off. Adjust the ballistic coefficient or whatever parameters you have and integrate again until you can start from the frst TLE and accurately predict the position/velocity of a future TLE. Make sense?
 
Last edited:

cristiapi

New member
Joined
May 26, 2014
Messages
222
Reaction score
0
Points
0
Location
Ancona
It makes plenty of sense! :) And it’s what I’m doing. To calibrate the Tiangong-1 parameters I do exactly what you say (I’m currently using 224 TLEs and I calculate several statistical parameters), while for the air density I can just take the result from the NRLMSISE-00 model as is (but I use the data file to keep it up to date). But I cannot agree with this:
A "correct" model would predict the same trajectory (reentry date) regardless of what TLE you use as your starting point.

because even the best model in the world cannot predict the same trajectory, because no parameter is exactly known.
The first error comes from the TLE uncertainty which is typically 1 km and when 1 km error is propagated in a perfectly written simulation, the final error will be much bigger.
For example, if I propagate one TLE, I obtain the following re-entry date: 2018-03-21 21:42 at a location situated on latitude= -17.5623 and longitude= -42.3516.
Then, I simply write rj2k[0] += 1 to translate the ECI J2000 x coordinate of the same TLE of 1 km and I obtain: 2018-03-25 06:32, latitude= 0.341365, longitude= -38.7379, a totally different re-entry date and location.

The second error comes from the conversion from the TEME reference frame (used for the TLEs) to ECI J2000 reference frame and it’s probably bigger than the former (because of the uncertainty in the nutation and precession values).

Also, consider that I don’t want to do a correct simulation because if, for example, I switch from WGS 84 gravitational model to the very accurate EGM2008 gravitational model, the time taken to propagate 200 days will be well beyond the actual Tiangong-1 re-entry date (it will probably take some years). Just consider that to propagate 200 days, the function that calculates the accelerations is called about 1.7 million times (with DOPRI853 integrator).
 

boogabooga

Bug Crusher
Joined
Apr 16, 2011
Messages
2,999
Reaction score
1
Points
0
It makes plenty of sense! :) And it’s what I’m doing. To calibrate the Tiangong-1 parameters I do exactly what you say (I’m currently using 224 TLEs and I calculate several statistical parameters), while for the air density I can just take the result from the NRLMSISE-00 model as is (but I use the data file to keep it up to date).

Okay. If you've calibrated, you've done what you can do.
:cool:

So what are you getting as output, a probability distribution?

It is hard to distinguish shades of blue. Is there a systematic relationship between the age of the TLE and the predicted re-entry date.
 

cristiapi

New member
Joined
May 26, 2014
Messages
222
Reaction score
0
Points
0
Location
Ancona
So what are you getting as output, a probability distribution?

I get the “usual” parameters: min, max, average, skewness, kurtosis, RMS error. But I don’t see any particular distribution for the reentry dates.

It is hard to distinguish shades of blue.

You’re right. I did that because with the old versions the range of the reentry dates was much wider.

Is there a systematic relationship between the age of the TLE and the predicted re-entry date.

No, I’d say:

Report_RDvsTLE_2017-09-04.png


If someone is interested in the data files, they can be downloaded from here (216 kB) as a 7z file.
 

boogabooga

Bug Crusher
Joined
Apr 16, 2011
Messages
2,999
Reaction score
1
Points
0
Yes, I'd say. Not linear, but you can see a kind of sine-wave developing. That might be a clue. Are you using a variable ballistic coefficient?
 

cristiapi

New member
Joined
May 26, 2014
Messages
222
Reaction score
0
Points
0
Location
Ancona
Yes, I'd say. Not linear, but you can see a kind of sine-wave developing. That might be a clue.

We can see two peaks of outliers and a wide region of uniformly distributed values. I meant that no useful fit seems possible with those data.

Are you using a variable ballistic coefficient?

Yes, I change the drag coefficient with the altitude. I’m currently using:
Cd= 2.05 * .91263 / .55
Cd *= .55 + ((-1.4119E-8 * ALT + 1.1568E-5) * ALT - 2.0701E-3) * ALT
but I need to change 2.05 and .55 when I update the simulation, because the biggest problem with the Tiangong-1 model is that I don’t know how to calculate the acceleration about the pitch axis (I don’t know the moment of inertia), so I rotate the station using an empirical angular speed (the angular speed is important because the cross sectional area is variable).
 

cristiapi

New member
Joined
May 26, 2014
Messages
222
Reaction score
0
Points
0
Location
Ancona
High solar activity means high air density at the Tiangong-1 altitude and the re-entry is now expected by the end of February:

TIA1-2017-10-13.png


I also slightly changed the Tiangong-1 model to improve the fitting of the new TLEs, but the geomagnetic and solar activity indices peaked on September and the air density increased accordingly:

AtmoData-2017-10-13.png
 

Urwumpe

Not funny anymore
Addon Developer
Donator
Joined
Feb 6, 2008
Messages
37,641
Reaction score
2,356
Points
203
Location
Wolfsburg
Preferred Pronouns
Sire
Is it already early enough to tell which places won't be more than 100 km away from any possible ground tracks during the final days?
 

Andy44

owner: Oil Creek Astronautix
Addon Developer
Joined
Nov 22, 2007
Messages
7,620
Reaction score
7
Points
113
Location
In the Mid-Atlantic states
Ah yes, the good old "Skylab Maneuver", showing the mastery of the skies with precision control of a spacecraft reentry through carefully planned inaction and lack of planning LOL. With my luck this thing's gonna hit my house.
 

cristiapi

New member
Joined
May 26, 2014
Messages
222
Reaction score
0
Points
0
Location
Ancona
Is it already early enough to tell which places won't be more than 100 km away from any possible ground tracks during the final days?

As far as I can tell (based only on my simulations), it should be possible to know the ground track with reasonable accuracy starting from the last 5 to 8 orbits and as long as the satellite is well outside the dense atmosphere (say above 80/100 km). From that point, only the telemetry will say the final ground track and the impact point.

The orbit inclination is currently oscillating from 42.71° to 42.75° and it seems that it won’t change significantly (it is slowly decreasing and will be about 42.715° +/- 0.02° at the re-entry time). If we consider 42.8° (just to be sure), you surely know that any point in the band +/-42.8° of latitude is a potential impact point.
 

Urwumpe

Not funny anymore
Addon Developer
Donator
Joined
Feb 6, 2008
Messages
37,641
Reaction score
2,356
Points
203
Location
Wolfsburg
Preferred Pronouns
Sire
Well, I had to ask, your last simulation set already covers just a few days, which would be on a magnitude of 100 orbits. Maybe its already accurate enough to make such a prediction, for example for telling if some bigger populated centers can already be considered safe.
 

Urwumpe

Not funny anymore
Addon Developer
Donator
Joined
Feb 6, 2008
Messages
37,641
Reaction score
2,356
Points
203
Location
Wolfsburg
Preferred Pronouns
Sire
Not sure to understand (my English is not too good), what do you mean?

Well, the you have simulated multiple trajectories with varying parameters and the reentry happens in an interval of 8 days in all those scenarios. Which means, since each day has about 16 orbits, that there are less than 8x16 = 64 orbits possible between first possible reentry and last possible reentry.

Now, you can't just connect the hypothetic reentry locations by simple lines, but you could show the ground track of each middle scenario like that:

"Sort scenarios by impact time"
"For each scenario:"
"Start ground track at reentry time of previous reentry scenario"
"End ground track at reentry time of next reentry scenario."
"Plot ground track of this scenario between the dates"
"Mark impact position of this scenario".

If you plot each ground track with a 200 km wide brush, the places below the ground tracks should still be in danger - the other places not.
 

cristiapi

New member
Joined
May 26, 2014
Messages
222
Reaction score
0
Points
0
Location
Ancona
I could try, but I would get just random tracks. The same reliability would be obtained if you use a random number generator instead of my simulation. :)
While the reentry date is reasonably accurate (provided that the atmospheric density is accurate), the ground track is very inaccurate.
 

Urwumpe

Not funny anymore
Addon Developer
Donator
Joined
Feb 6, 2008
Messages
37,641
Reaction score
2,356
Points
203
Location
Wolfsburg
Preferred Pronouns
Sire
I could try, but I would get just random tracks. The same reliability would be obtained if you use a random number generator instead of my simulation. :)
While the reentry date is reasonably accurate (provided that the atmospheric density is accurate), the ground track is very inaccurate.

Damn, I would have expected some checkerboard pattern already. Nevermind. :thumbup:
 

infotechggs

New member
Joined
May 29, 2014
Messages
10
Reaction score
0
Points
1
High solar activity means high air density at the Tiangong-1 altitude and the re-entry is now expected by the end of February:

TIA1-2017-10-13.png


I also slightly changed the Tiangong-1 model to improve the fitting of the new TLEs, but the geomagnetic and solar activity indices peaked on September and the air density increased accordingly:

AtmoData-2017-10-13.png

Hi Cris, i can perform a reentry simulation for the tiangong using orbiter, or better i can try to simulate approaching some info and coefficients,just give me some time to do it.
Just for curiosity,which type of software did you use to plot the space weather on this picture?
 
Top