Problem How to find displacement versus time from a distance versus graph

doctsh

New member
Joined
Oct 22, 2011
Messages
10
Reaction score
0
Points
0
Dear friends,
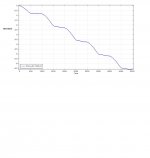
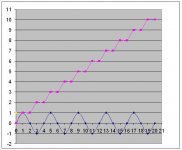
I have a distance (scalar) versus time graph of a flapping ornithopter. I want to sketch displacement (vector)versus time graph from this. I know that this should be like a sine wave. I dont know how to convert this. Actually distance time graph has accumulated displacement that I know, but I could not figure out a quick formula.
Please some one help me.
thanks in advance
 

Attachments

  • ORB.jpg
    ORB.jpg
    53.7 KB · Views: 10
Thanks for your reply.
Here are the details:

Consider an ideal, one dimensional simple pendulum oscillating with respect to time. The graph attached is the distance-time graph of such pendulum's bob. The distance travelled keeps on increasing with respect to time. I want to sketch position or displacement versus time. We know that this should be a simple sine wave graph. I want to know, having got all the data of the distance-time graph, is there any way to obtain position time graph?

ps: In the distance-time graph, in the negative half-cycle, it is simple added as this is scalar quantity. but I want to show vector nature of pendulum returning. so looking for a position-time or displacement-time graph.

Thanks for your reply. I hope now more details are given.
 
So correct me if I'm wrong, but what I understand is that the graph shows the total cumulative distance covered versus time.

What you want to find is the displacement versus time. This would be the rate at which the area under the curve is increasing(or decreasing). So just integrate that curve(analytically or numerically) and you will get position versus time. You have to pick a starting point though, zero would work.
 
Hi
Thanks.
Please have a look at the attached picture.
The blue curve is position time and magenta is distance time. I just want to formulate a quick method to convert magenta curve to blue curve.
Any possiblity please...
 
Sorry
picture was not attached.
Here is the picture
 

Attachments

  • orbiter.JPG
    orbiter.JPG
    37.2 KB · Views: 12
Okay, the blue curve looks like sine(t), the magenta one looks like t+sin(t).

So, subtract t from the magenta curve.
 
Okay, the blue curve looks like sine(t), the magenta one looks like t+sin(t).

So, subtract t from the magenta curve.

Minor nitpick here...

a*t + b*sin(c*t)

You'll need to find a, b and c from your data. c is simple, it's the frequency of the sine in radians per second. b is the amplitude of the sine wave. Once you find these two, subtract b*sin(c*t) from the data and you should get a straight line. a can then be found as delta(y) / delta(x).


Without loss of generality ...
 
Thanks a lot for your useful comments. I think now I will be able to do.
 
Back
Top