measuring irregularities in the wave

doctsh

New member
Joined
Oct 22, 2011
Messages
10
Reaction score
0
Points
0
Hi
Everyone.
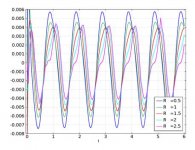
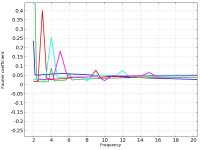
In one experiment I got output as in the attached picture. I want to compare the waves. Some waves look complete and symmetric and some seem to have irregularity/aperiodicity.

Having got the numerical data (without defining equation), is there any way to measure the difference in shape of the waveforms? at least their antisymmetric nature?

Thanks in advance as I learn a lot everytime visiting this forum and explore lot everytime posting something in this forum.

Doctsh
 

Attachments

  • irrugalirty.jpg
    irrugalirty.jpg
    32 KB · Views: 22
Thanks for the reply. In fact I did that too. I got a frequency spectrum plotted between fourier coefficients and frequency it reads as attached. Does that explain any symmetry in a meaningful way? In particular in the data obtained the blue curve is more regular and symmetric with respect to x-axis and then all other loosing the symmetric nature. Do I get that from this spectrum?

Thanks in advance.
 

Attachments

  • freqspectrum.jpg
    freqspectrum.jpg
    48.6 KB · Views: 12
Last edited:
Thanks for the reply. In fact I did that too. I got a frequency spectrum plotted between fourier coefficients and frequency it reads as attached. Does that explain any symmetry in a meaningful way? In particular in the data obtained the blue curve is more regular and symmetric with respect to x-axis and then all other loosing the symmetric nature. Do I get that from this spectrum?

Thanks in advance.

It should show fewer and stronger frequency peaks on regular waves compared to non-regular waves: see the differences between the blue and the violet plots. Try to plot it in a semilogY or in a loglog plot, it usually makes more sense as log plots separate peaks in much a clearer way.

Your spectrum plot is kind of odd: by looking at the time/amplitude plot, it seems that the main frequency of the blue curve is ~'1', while the minimum value for the frequency is '2', which makes me wonder whether the spectrum plot really uses the inverse time on the abscissa (x axis). Also, from the time/amplitude plot, I'd say that the blue wave has a stronger low frequency peak than the green one. Yet, the green wave has a stronger peak instead (the one at frequency = '2').

I do not know which technique you used to compute the spectrum plot, but cutting off the initial transient might be better to analyse your waves. Also try to use a bigger sample.
 
Back
Top