Question Help generating a graph

tblaxland

O-F Administrator
Administrator
Addon Developer
Webmaster
Joined
Jan 1, 2008
Messages
7,320
Reaction score
25
Points
113
Location
Sydney, Australia
I have two sets of data that I would like to plot on the same chart. One set consists of a table representing a function z = f(x,y), the other is a table representing a function y = f(x). I want the chart to have primary axes of x and y and show z=f(x,y) as a colour or shade based on its value. This then overlaid by a line representing y=f(x). The chart could be either polar (preferred) or rectangular.

Can anyone recommend a software package (preferably free) that will allow me to do this? Excel does not seem up to the task, but if someone knows a way I am happy to try it.
 

Woo482

Moderator
Moderator
Addon Developer
GFX Staff
Joined
Feb 13, 2008
Messages
3,048
Reaction score
20
Points
78
Location
Earth?
are you sure Microsoft Excel can not do it ?
 

tblaxland

O-F Administrator
Administrator
Addon Developer
Webmaster
Joined
Jan 1, 2008
Messages
7,320
Reaction score
25
Points
113
Location
Sydney, Australia
are you sure Microsoft Excel can not do it ?
Well, I could not see how to do it but I would not put myself in the "advanced user" category when it comes to Excel. I can see how to make a graph for z=f(x,y) in Excel (Excel calls it a Surface) but how to overlay the y=f(x) line is the problem. Note also that my sample points for z=f(x,y) are evenly distributed in x and y, but they are not for y=f(x). This is important in Excel because it uses "categories" and "series" indexes for the x and y axis, not the x and y values themselves.

EDIT: I don't have the actual functions z=f(x,y) and y=f(x). All I have are tables with samples for numerous values in those functions. For those that are interested, z=f(x,y) represents the proportion of a window that is in direct sun at various times of the day. y=f(x) is the sun position, where x is azimuth angle and y is altitude angle.
 

Woo482

Moderator
Moderator
Addon Developer
GFX Staff
Joined
Feb 13, 2008
Messages
3,048
Reaction score
20
Points
78
Location
Earth?
What kind of Graph are you doing ?
 

Woo482

Moderator
Moderator
Addon Developer
GFX Staff
Joined
Feb 13, 2008
Messages
3,048
Reaction score
20
Points
78
Location
Earth?
well I am not 100% sure on how to do it then I have only just started using Excel a few months ago
 

Thunder Chicken

Fine Threads since 2008
Donator
Joined
Mar 22, 2008
Messages
4,404
Reaction score
3,330
Points
138
Location
Massachusetts
are you sure Microsoft Excel can not do it ?

Excel absolutely cannot do this, though it has a feature that is darn close. Unfortunately you don't have control over the axes.

I would recommend Gnuplot (http://www.gnuplot.info/). It uses a command line interface which you'll either love or hate, but it really isn't bad. It's pretty powerful, and the documentation is pretty good.

You can plot contours using the splot command:

http://www.gnuplot.info/docs/node329.html

Note that you can splot either numerical data in a XYZ text table or by using a function f(x,y)

You can then plot the line using the plot command:

http://www.gnuplot.info/docs/node100.html

Tweaking colors and axes and such will require a little reading, but it doesn't take long. You can save your commands in an input file if you want to come back later.
 

mjessick

Donator
Donator
Joined
Apr 26, 2008
Messages
174
Reaction score
0
Points
0
Location
Houston
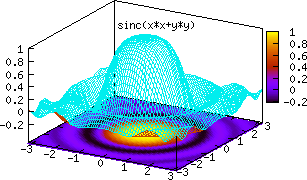
GnuPlot is an open source engineering plot package that has 20+ years of development. It can do 2D, 3D and also 2D "contour" plots of 3D data. It may be a little harder to use because the commands need to be scripted to control the drawing. (That is, you type or load a file with many settings for labels, tic marks, and so on, and a "plot" command with a bunch of arguments to create the drawing.)
It can pretty much do anything. (Although it might take awhile to figure out which features to use.)

http://www.gnuplot.info/

You can download, unzip, then run the demos to see it in action or see the demos on this page:
http://gnuplot.sourceforge.net/demo_4.2/
The webpage also has a gallery.
title2.png
 

tblaxland

O-F Administrator
Administrator
Addon Developer
Webmaster
Joined
Jan 1, 2008
Messages
7,320
Reaction score
25
Points
113
Location
Sydney, Australia
Thanks, TC & mj. That looks like it will fit the bill. Off to do some reading...
 
Top